


Talking Points:
- Tonight brings Japanese inflation numbers for the month of March, and of recent this has become a hot-button topic around the Bank of Japan as price growth in the Japanese economy printed faster than Europe in February. This highlights the potential for a shift-away from the uber-loose monetary policy that’s become par for the course at the Bank of Japan.
- As we’ve come into Q2, Yen-weakness has started to show again and this highlights the possibility of a continuation of trends that have been a rather attractive area of the FX market since the election of PM Shinzo Abe in 2012. Will tonight’s inflation print help markets move further back from the edge of risk aversion that showed in Q1, helping to drive Yen-strength?
- DailyFX Forecasts have been updated for Q2, and are available from the DailyFX Trading Guides page. If you’re looking to improve your trading approach, check out Traits of Successful Traders. And if you’re looking for an introductory primer to the Forex market, check out our New to FX Guide.
Do you want to see how retail traders are currently trading the US Dollar or the Japanese Yen? Check out our IG Client Sentiment Indicator.
Japanese Inflation is On Deck
There are two high-impact releases remaining on the DailyFX Economic calendar for the remainder of the week, and each are inflation prints. Later tonight, we’ll get Japanese inflation for the month of March and then tomorrow morning at 8:30 AM ET, we’ll get Canadian inflation numbers for the same period. Outside of that – we have both the US Dollar and EUR/USD sticking to their range-bound behaviors, making for a less-compelling backdrop for trends or momentum setups in those markets.
DailyFX Economic Calendar: Japanese, Canadian Inflation Remain on This Week’s Calendar

prepared by James Stanley
Yen Weakness Shows Ahead of Japanese Inflation
As we came into 2018, the Japanese Yen retained a general tonality of weakness from the theme that had started in 2012. This is when Shinzo Abe was re-elected to the PM post in Japan, and this came along with the ‘three pillars’ approach towards economic policy, later dubbed ‘Abenomics’.
A key part of that approach was Yen weakness. This would allow the export-heavy economy to ship more goods overseas, thereby helping to solidify domestic markets so that growth and inflation could return after a decades-long struggle with deflation. Initially, this showed some promise: The Yen-weakened for most of 2013 and 2014 and even the first part of 2015. And while inflation soon moved above the BoJ’s 2% target, it couldn’t hold, and the rate of price growth was back-below one-percent in short order. This gave the Bank of Japan considerable flexibility with their QE program, as there were few reasons to worry about consequences of ‘too much liquidity’ as inflation remained subdued.
USD/JPY Weekly Chart: Abenomics-Fueled Weakness Remains After 50% Pullback in 2015-2016
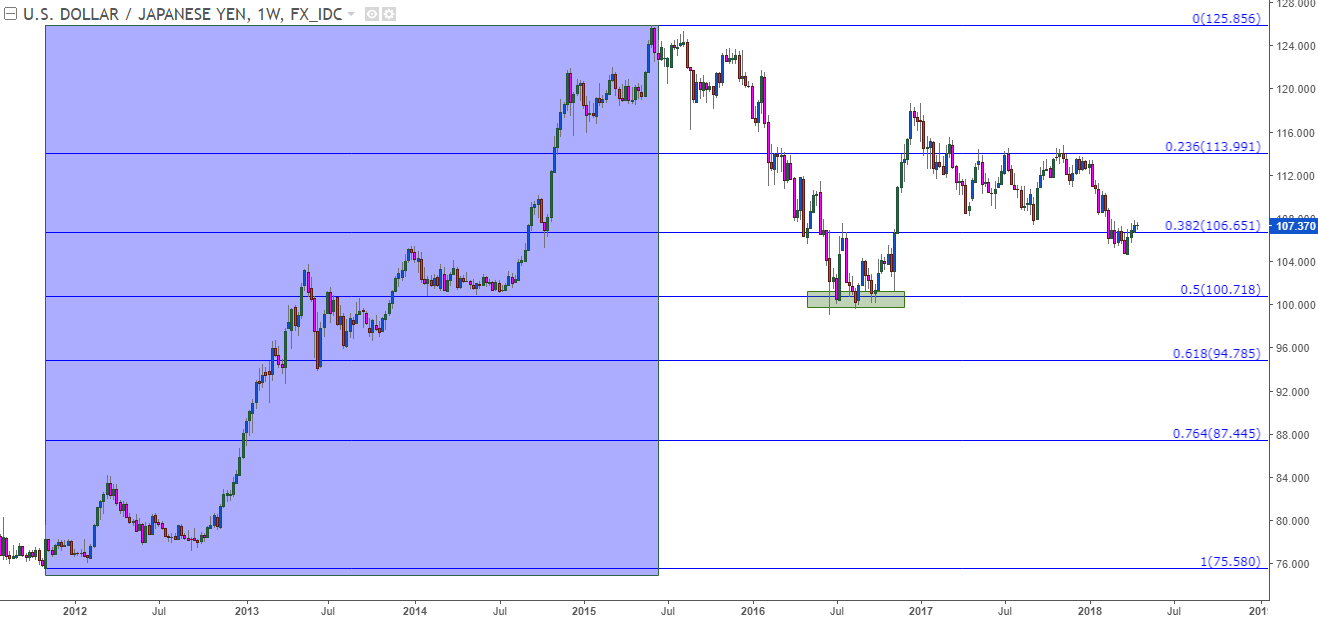
Chart prepared by James Stanley
Yen strength became an operable theme again after China’s ‘Black Monday’ in the summer of 2015. A worrying bout of risk aversion that ended up becoming a blip in the radar helped to elicit a 50% pullback in that prior theme of Yen-weakness. Support eventually set-in around the 100.00 level, and it was the 2016 Presidential election that helped to bring back weakness into the pair. This was driven by the presumption that in an environment of rising tides, the Yen would remain weak as inflation expectations moved-higher the world-around.
As last year’s USD-weakness began to take-over, a range developed in USD/JPY. That range held for the better part of nine months before finally succumbing to Yen-strength in the first couple months of this year.
USD/JPY Daily Chart: After Spending Most of 2017 in a Range, Bearish Trend Shows in 2018

Chart prepared by James Stanley
Trend Reversal Potential Begins to Show in 2018
This bout of Yen-strength appeared to be driven by a factor that started to change around December of last year. This is when inflation popped-up to one-percent for the first time in over a year, and this started to get attention from market participants, but we were still at 50% of the BoJ’s target. It wasn’t a pressing concern until we got deeper into 2018 and saw that inflation was continuing to climb at a rather aggressive clip. January inflation came in at a 34-month high of 1.4%, and then February printed at 1.5%.
Japanese Inflation Prints at 35-Month High in February
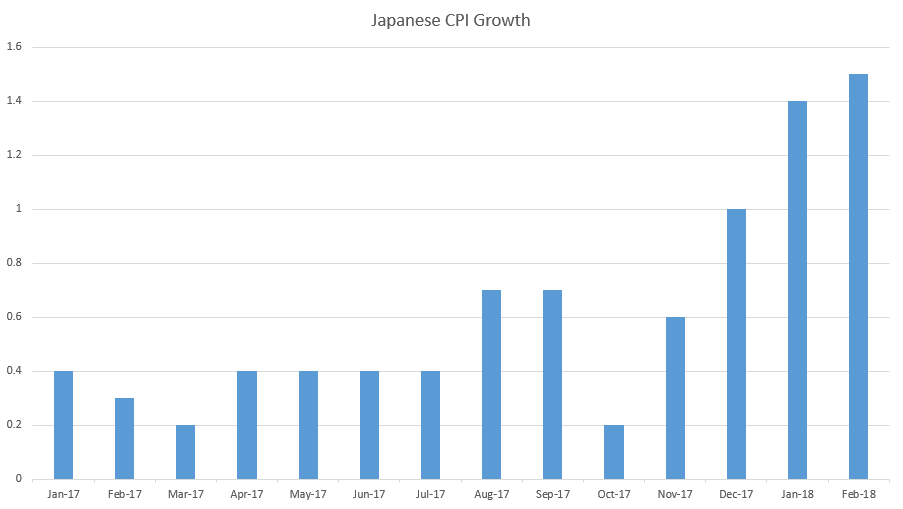
Chart prepared by James Stanley
As this was happening, we started to see Yen-strength show against most currencies as those prior QE-fueled bets further unwound. There was a fear of ‘stealth tapering’ of the BoJ’s QE outlay, and there was a very legitimate threat of the Yen acting as the Euro did last year. This was marked by a very strong final eight months of 2017 that saw more than 2,000 pips of gains, driven by market participants gearing up bets for tighter policy out of the ECB, in large part due to a response in improving economic data.
USD/JPY Four-Hour Chart: Yen-Strength Shows in Q1, Begins to Reverse in April
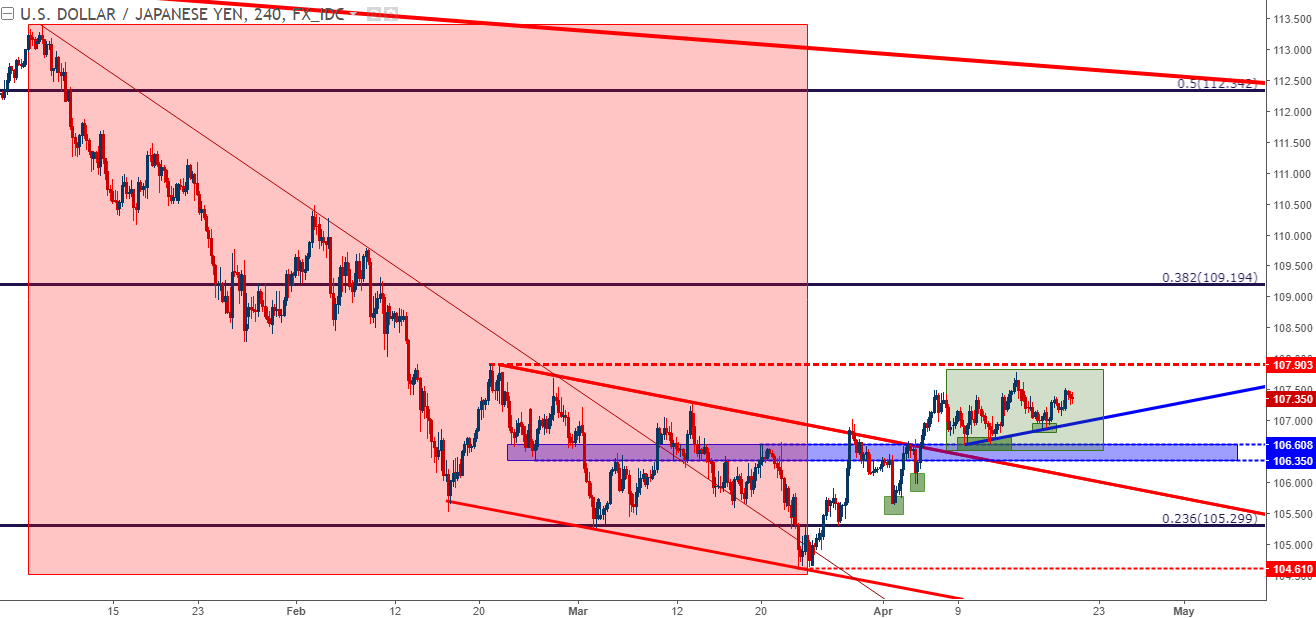
Chart prepared by James Stanley
That tighter policy from the ECB still hasn’t arrived yet, but the Euro continues to hold on to last year’s gains. The Yen started to show strength against the US Dollar in January, and put in a move of continuation in February which mostly held through March. But as we’ve opened the door into April, weakness has started to show again and this may be something that could remain as usable for FX traders.
The expectation for tonight’s inflation print is 1.1%, and if we do come-in here or below the expectation, that door remains open as we see even more pressure removed from JPY. If we do get something around the January read of 1.4% or higher, then Yen-strength may be on the way back as we will no longer be looking at a temporary blip of inflationary strength.
As we walk into tonight’s inflation data, the initial stages of Yen-weakness, or strength in USD/JPY has started to show. We’ve been following the build of higher-lows in the pair since the final days of March, and that’s largely continued since as buyers have continued to come-in to bid at higher-lows. This hasn’t been a runaway bullish response just yet, as that strength has waned as we’ve moved up to approach the prior swing-high at 107.90.
USD/JPY Hourly Chart: Higher-Highs, Higher-Lows as Yen-Weakness Shows Signs of Return

Chart prepared by James Stanley
The Yen Away from the US Dollar
The complication with doing anything directional around the US Dollar at the moment is the drama that goes along with the US Dollar. Not only do traders have to contend with what’s become considerable headline risk based on a series of themes like trade wars; but there’s a well-built down-trend that’s more than a year old, and there are solid cases to be made for both continuation of that move as well as a short-squeeze scenario that could see prices retrace-higher. This makes for a tough backdrop when planning a long-term scenario.
More attractive for Yen-weakness may be currencies such as the Euro or the British Pound. While both EUR/JPY and GBP/JPY are rather volatile on an intra-day basis, longer-term setups in each pair will often incorporate these themes in a directional manner.
GBP/JPY
In GBP/JPY, a stark reversal of the prior year’s strength showed-up in February, and the pair sold-off by more than 1,000 pips. Support eventually showed at the 145.00 psychological level, and the month of March was mostly spent with prices gyrating higher, eventually finding resistance at an area of prior support.
That theme of GBP/JPY strength broke-out in early-April as we started to see a rather aggressive rally take shape in the British Pound. Prices were soon back above the post-Brexit trend-line, surging up to fresh monthly highs. The move pulled-back yesterday around the UK inflation print that helped to elicit a pullback in GBP, and so far we’ve seen support holding at prior resistance, which happens to come-in around a key Fibonacci level. We looked at the setup yesterday and since then, we’ve seen a continued hold of support as we near tonight’s Japanese inflation data.
GBP/JPY Four-Hour Chart: Strength Returns in April as Prices Re-Claim Post-Brexit Trend-Line
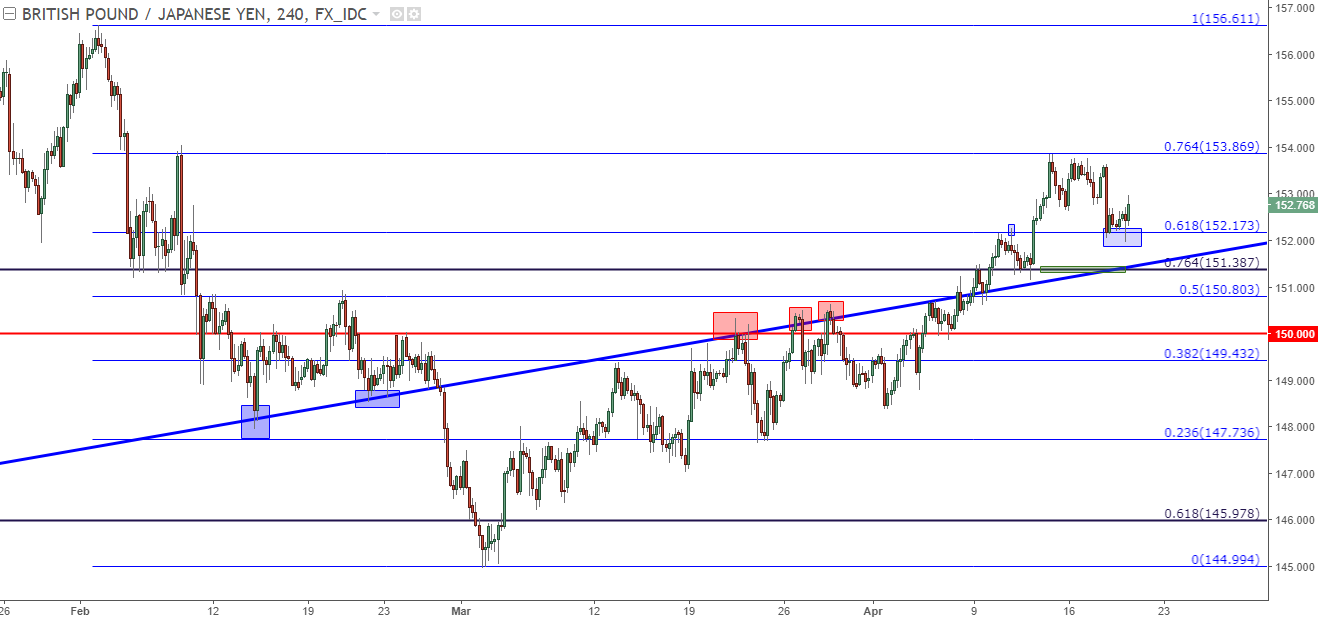
Chart prepared by James Stanley
The big question around GBP/JPY as we approach tonight’s inflation data is whether or not the current area of support will hold as the higher-low. For longer-term construction of the bullish trend, a deeper pullback may actually make the scenario a bit more attractive, as we have a support level around 151.39 that would be confluent with that post-Brexit trend-line.
GBP/JPY Hourly Chart: Short-Term Support Holds, But Deeper Pullback Potential Remains
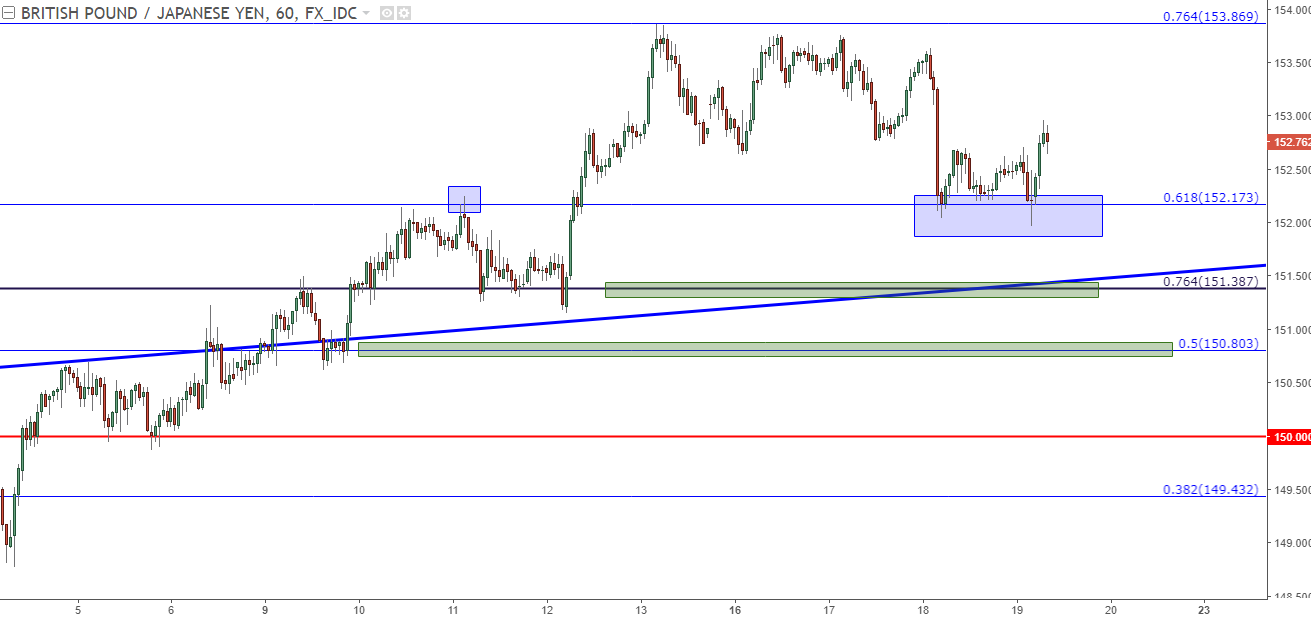
Chart prepared by James Stanley
EUR/JPY Testing March Highs After Re-Claiming Key Support
We’ve seen a similar environment in EUR/JPY: A previously well-built bullish trend started to pullback in February and March, with strength starting to return in April. This opens the door to the possibility of continued gains in the pair, and we’ve been following a key zone of prior support/resistance in EUR/JPY. This zone runs from 131.43-132.05, and this area helped prices to find support for the final four months of 2017. This area eventually became resistance in March, and with prices moving back-up in April, it has re-emerged as support.
EUR/JPY Daily Chart: Strength Returns in April as Prices Re-Claim Key Zone

Chart prepared by James Stanley
EUR/JPY Testing Two-Month Highs
As we approach tonight’s Japanese inflation data, prices in EUR/JPY are testing two-month highs. We’ve seen a continuation of bulls coming in at higher lows, but as of yet, that bullish response has been rather subdued as strength has showed a tendency to wane near tests of prior highs. If we do see Japanese inflation soften at tonight’s print, the possibility of upside remains as more pressure is removed from the Yen, and the pair can get back to the prior bullish trend.
EUR/JPY Four-Hour Chart: Testing Two-Month Highs

Chart prepared by James Stanley
To read more:
Are you looking for longer-term analysis on the U.S. Dollar? Our DailyFX Forecasts for Q1 have a section for each major currency, and we also offer a plethora of resources on USD-pairs such as EUR/USD, GBP/USD, USD/JPY, AUD/USD. Traders can also stay up with near-term positioning via our IG Client Sentiment Indicator.
Forex Trading Resources
DailyFX offers a plethora of tools, indicators and resources to help traders. For those looking for trading ideas, our IG Client Sentiment shows the positioning of retail traders with actual live trades and positions. Our trading guides bring our DailyFX Quarterly Forecasts and our Top Trading Opportunities; and our real-time news feed has intra-day interactions from the DailyFX team. And if you’re looking for real-time analysis, our DailyFX Webinars offer numerous sessions each week in which you can see how and why we’re looking at what we’re looking at.
If you’re looking for educational information, our New to FX guide is there to help new(er) traders while our Traits of Successful Traders research is built to help sharpen the skill set by focusing on risk and trade management.
--- Written by James Stanley, Strategist for DailyFX.com
To receive James Stanley’s analysis directly via email, please SIGN UP HERE
Contact and follow James on Twitter: @JStanleyFX


