


Talking Points:
- Tomorrow brings Thanksgiving in the United States, but before we get to that, we get FOMC meeting minutes this afternoon and ECB meeting minutes tomorrow morning.
- Retail sentiment has calmed in EUR/USD, while beginning to stretch a bit more in USD/JPY and AUD/USD. Click here to access our IG Client Sentiment Indicator.
- Looking for trade ideas? Check out our trading guides. And if you’re looking for something more interactive in nature, check out our DailyFX Webinars.
To receive James Stanley’s Analysis directly via email, please sign up here
Tomorrow brings the Thanksgiving holiday in the United States, and this will likely bring on some form of diminished liquidity across Foreign Exchange markets. And while lower liquidity can, possibly lead to bigger moves; this isn’t necessarily a ‘good thing’ as those larger moves can be considerably more erratic in nature. We’ve already started to see some evidence of holiday markets this week as prior trends in EUR/USD or the U.S. Dollar itself have been digesting prior moves while sticking to rather minimal ranges.
But that may not last… Today at 2PM brings FOMC minutes and tomorrow morning brings the release of ECB meeting minutes from last month’s rate decision that saw the bank extend their QE program. The release of ECB minutes could be especially interesting given the decision that was made; as this can add some clarity around the bank’s thinking while giving market participants some element of lead-in to what the bank is looking for next year.
While minutes releases are pretty far-away from a sure-shot of volatility, the fact that these are being released in what will likely be lower-liquidity markets make the prospect of short-term trading around each rather dangerous. So, rather than looking at short-term trade setups in the effort of catching entries around news events in holiday-quiet markets, we’re going to take a step back to look at longer-term setups in some key major pairs below. These could still be actionable should the situation present itself; but given that the propensity for ‘weird stuff’ happening increases around these traditionally quieter times, we’re taking a more selective route towards taking on exposure.
The U.S. Dollar
The Greenback remains in limbo, and we looked into the varying trends relationships behind the Dollar in yesterday’s article. The longer-term trend, starting in 2014 remains bullish. The intermediate-term trend that started at the beginning of this year remains bearish. And the near-term trend is in some form of transition where it appears as though markets are trying to pick a side; hence, our current state of limbo.
It looked as though the longer-term bullish trend was re-igniting as we came into November. After the ECB rate decision, the Dollar popped-up to a fresh three-month high, driving above a key zone of resistance that had held the highs in the Dollar since July. But, after two weeks of buyers trying to dig-out support above old resistance, sellers took back over to drive prices back into the prior three month-range. The shorter-term trend that started in September could still be approached in a bullish manner, as support is holding around the 38.2% retracement of that move while resistance continues to populate around the 23.6% level.
U.S. Dollar via ‘DXY’ Four-Hour: Support Holds at 38.2% of Recent Bullish Move
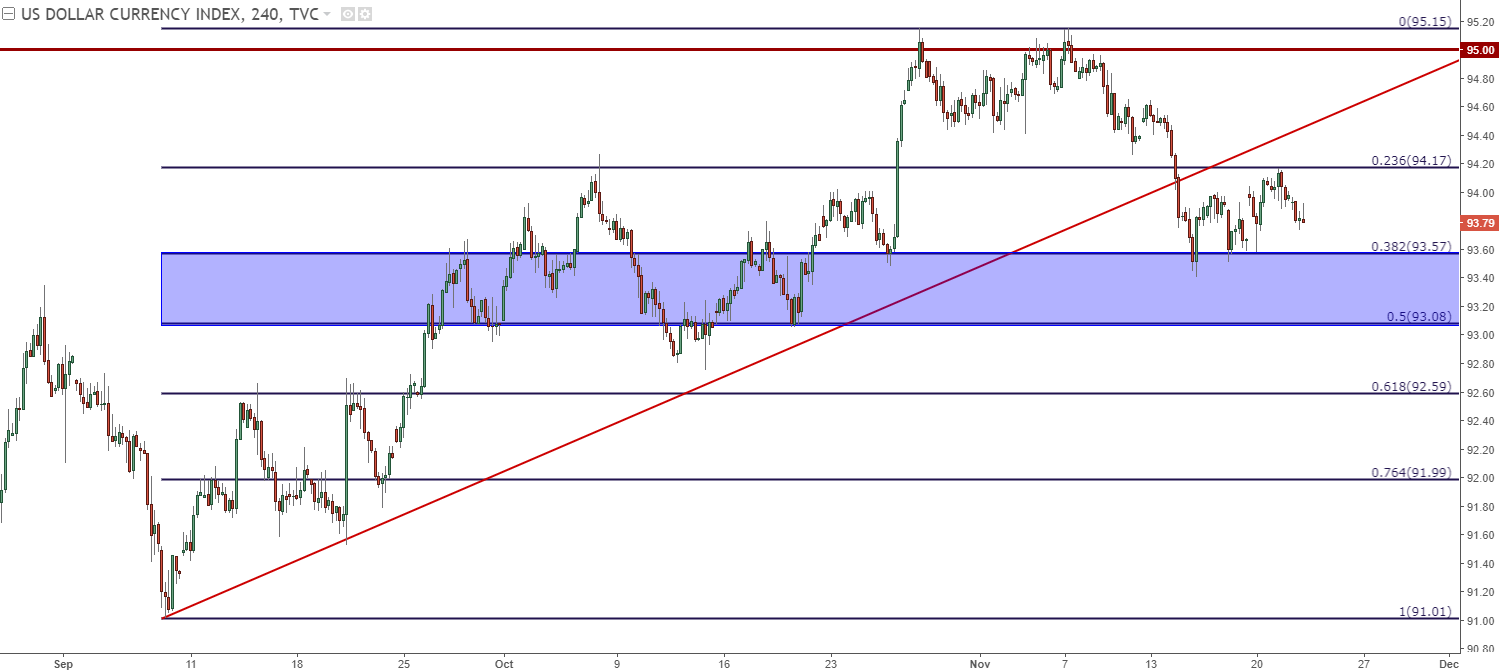
Chart prepared by James Stanley
Traders looking to assign a longer-term direction to the Dollar will likely want to let prices formulate some type of direction before doing so. Resistance held in a fairly rigid manner between 95-95.15, so this can be an ideal ‘tell’ level to look for bullish continuation into year-end. Meanwhile, on the support side of the equation, traders can look for a break below either 93.08 (the 50% retracement) or 92.50 to signal bearish potential.
DXY Daily: Bearish 2017 Trend Remains, Allow Support/Resistance Break to Signal Directional Biases
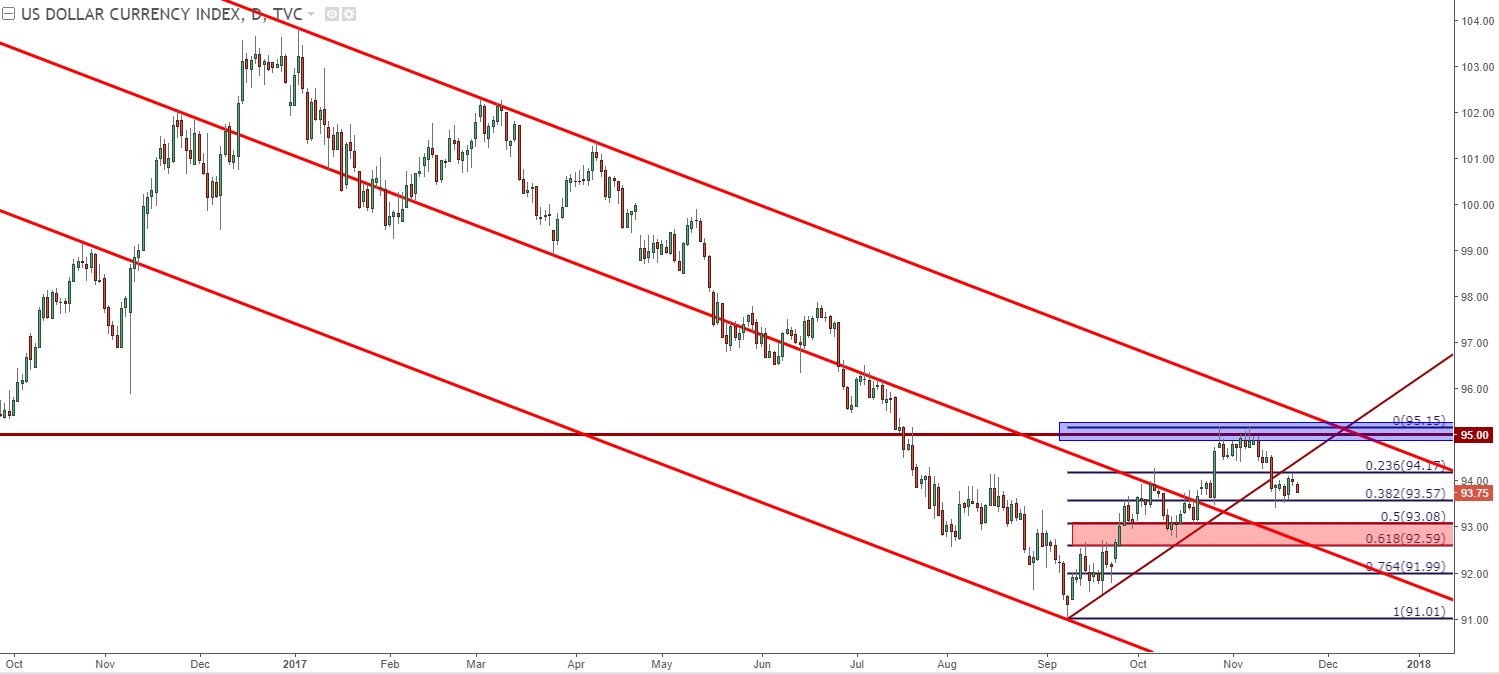
Chart prepared by James Stanley
EUR/USD
EUR/USD is in a very similar spot as yesterday, sitting atop a support zone that’s been active in the pair for the better part of the past three months. After first digging out support around this level in August, recurrent runs in September and October also found buyers. It wasn’t until that ECB rate decision that prices were finally able drive prices below this area, after which resistance began to show around the Non-Farm Payrolls report earlier in the month.
But after last week’s red-hot GDP reports out of Germany, Euro strength began to show again and prices popped right back-above this key area. Bulls continued to drive until resistance showed-up around a batch of prior swing-highs in October. At this point, a shooting star printed on the daily chart, and prices tempered-lower until buyers showed-up, again, around this zone of support.
EUR/USD Daily: Support at Top of Key Zone, Resistance at Oct. Swing Highs
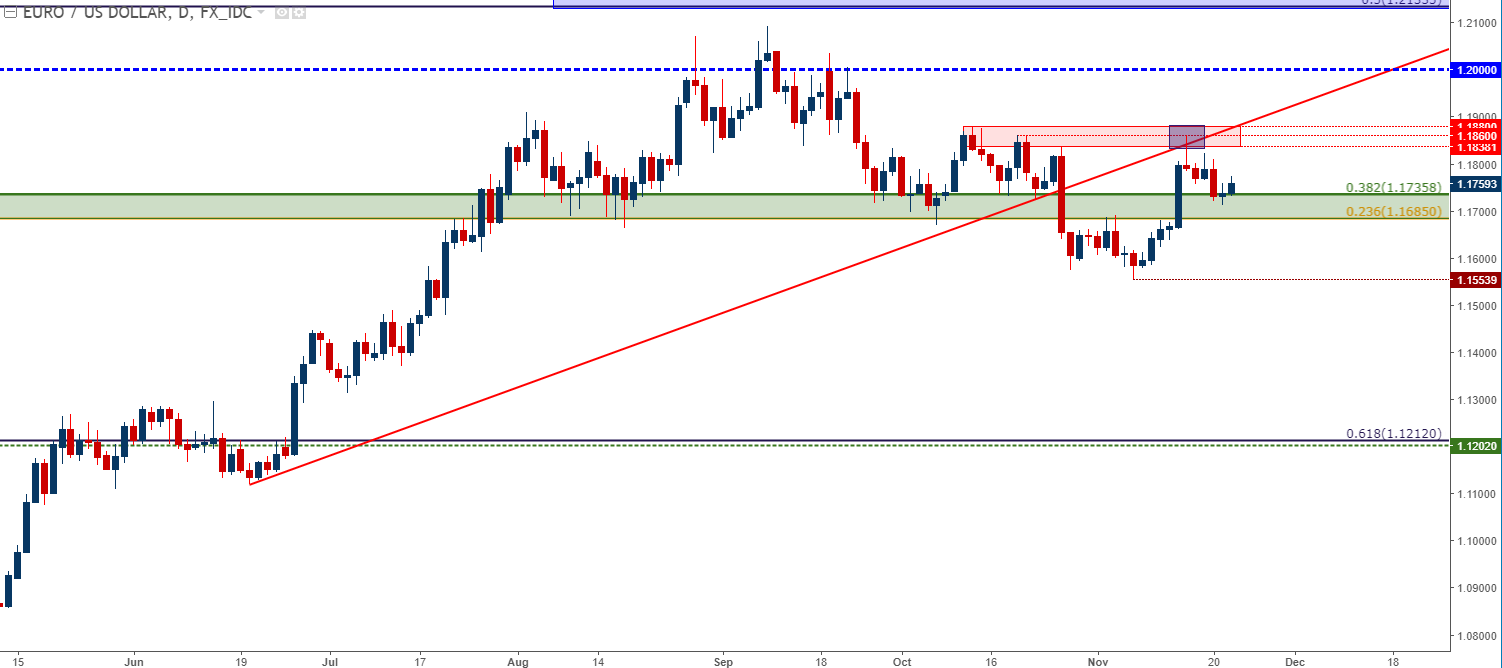
Chart prepared by James Stanley
As we wrote last week, t here were actionable setups on either side of EUR/USD, and that remains to a degree today. Traders taking a longer-term approach can look to the bearish side of the pair, plotting risk levels above the recent group of swing-highs while targeting the prior low around 1.1553. The shorter-term approach would likely be looking in a more bullish manner, plotting for continuation of the shorter-term trend that started to show last week.
Cable is dropping again this morning after the unveil of the UK budget, but on a longer-term basis the pair remains mired within a sloppy are that has little definition or trending capacities. The 2017 bullish channel in GBP/USD remains active, albeit sloppy after the past few weeks have seen prices oscillating near the support side of the channel, threatening a down-side break. For bullish approaches, traders would likely want to see resolution of the resistance area around 1.3320. This is a key Fibonacci level that’s twice brought sellers in to reverse a bullish move. And on the bearish side, a break-below 1.3000 would open up the prospect of a deeper reversal of this year’s bullish trend.
GBP/USD Daily: Mean-Reversion After Support Grind at Bottom of Channel
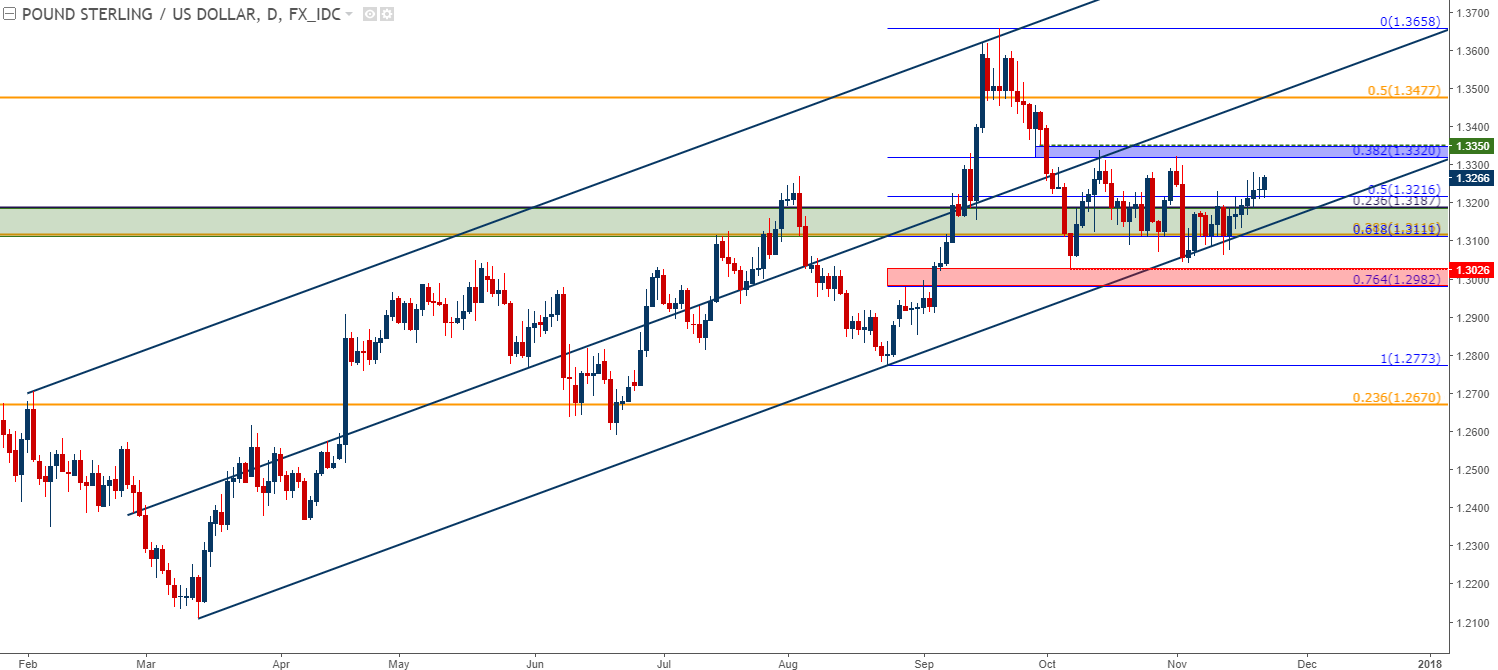
Chart prepared by James Stanley
AUD/USD
AUD/USD has been one of our favored pairs to work with around the prospect of USD-strength, allowing the trader to avoid pairing up two currencies that are in some form of trend transition. While that Dollar strength has gone missing against the Euro, it’s remained against the Australian Dollar for much of the period since late-September.
Last week saw prices beginning to probe around an interesting area of potential support at .7529. This is the 61.8% retracement of the 2017 bullish trend, and just a bit below at .7500-flat we have a major psychological level in the pair. This has helped buyers populate to show some element of support, and already prices are trickling higher.
We have two areas of possible resistance. The first, which is testing currently, can be taken off of the under-side of the bullish trend-line for the 2017 AUD/USD move. But just above, we have the 50% retracement of that move that had offered a considerable amount of support before last week’s breakdown. This can keep the door opened for short-side exposure in the aim of trading a continuation of USD-strength.
AUD/USD Daily: Support at 61.8% Fib, Resistance at Under-Side Bullish Trend-Line
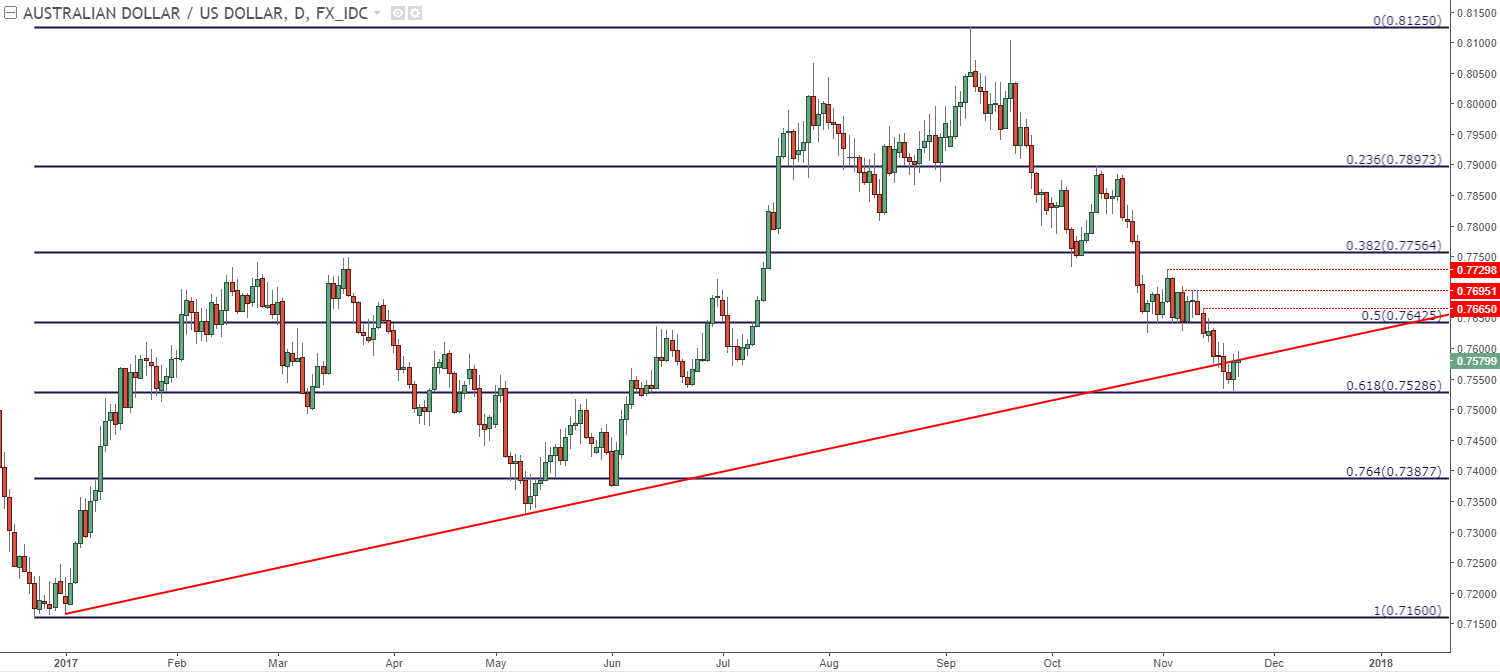
Chart prepared by James Stanley
USD/JPY
Dollar weakness is continuing to show against the Yen, and this comes after two weeks of resistance saw sellers grind through buyer demand at a key area of resistance. This resistance area can be plotted around 114.00, and this area has now reversed USD/JPY price action three times this year as a range has built-in on the daily chart.
Prices are now moving down to a key area of prior support/resistance. This area runs from 111.61-112.43, and this has played a role in the USD/JPY range throughout this year. Most recently, the bottom portion of this area offered higher-low support in mid-October as the pair was surging up towards that resistance level at 114.00. Prices began to test the top-side of that zone on Monday, and follow-thru bearish price action has continued to drive prices-lower.
At this stage, it looks as though a test of 111.61 is in the cards, and how markets respond here can be key to near-term directional observations. If support cannot hold above the prior 10/13 swing-low, the door is opened for short-side setups, targeting towards 110.00. If we do see buyers show up at or ahead of that level, bullish strategies can remain as an option under the presumption that a test of the top-side of the zone at 112.43 is in the cards, which can open up the possibility of a 114.00 re-test.
USD/JPY Daily: Range Resistance Holds, Prices Approaching Bottom of Key Zone 111.61
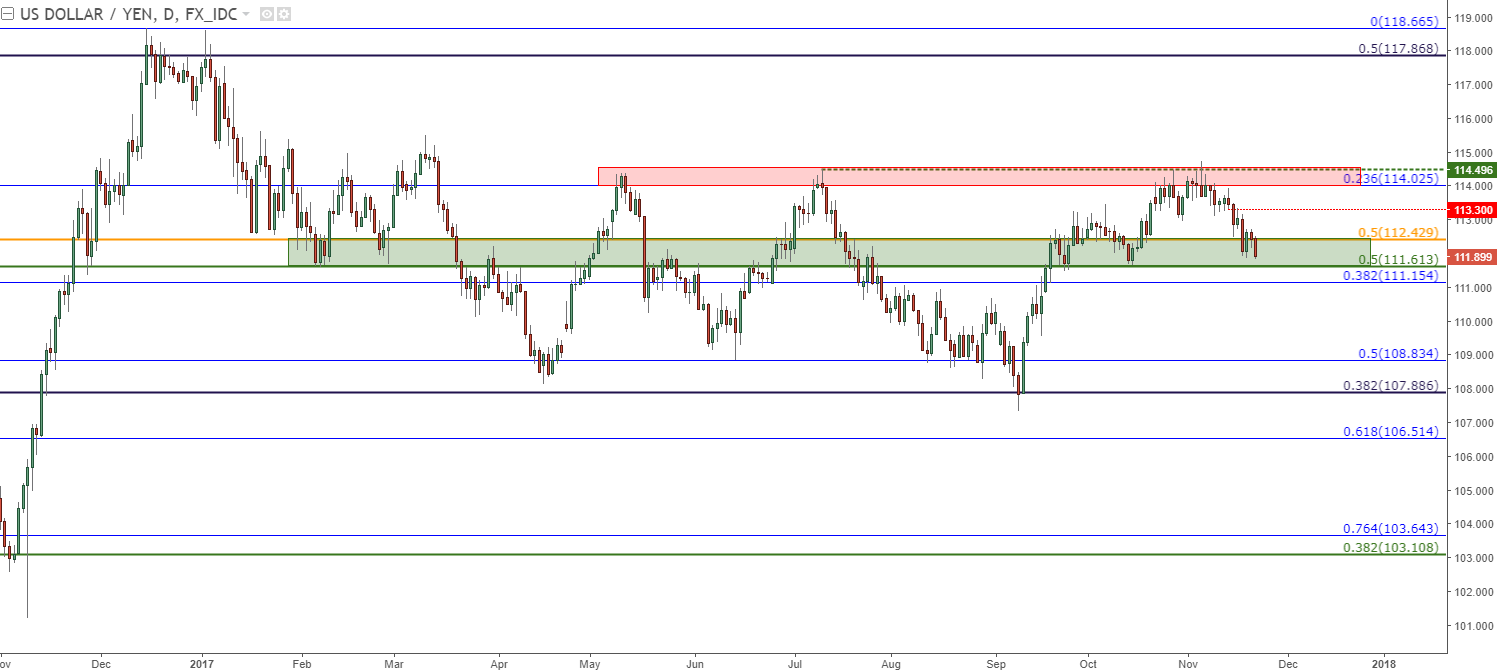
Chart prepared by James Stanley
--- Written by James Stanley, Strategist for DailyFX.com
To receive James Stanley’s analysis directly via email, please SIGN UP HERE
Contact and follow James on Twitter: @JStanleyFX


