


Key Highlights:
- USD strength has become a theme in September, but long-term doubts remain
- GBP remains strongest in G8 and sees nice lift on comment from EU’s Brexit negotiator
- EUR rebounds off strong multi-year support
- IGCS Highlight: Increase USD/CHF shorts favor failed triple-top pattern
Strong Weak Analysis is a way to identify momentum in the FX market. Trend traders rely on spotting and riding momentum as it develops and looks to benefit from trends extending, as many do. It’s also worth noting when the strength of a trend is waning, which Strong Weak analysis can also benefit.
Each day will bring you an index of strong and weak currencies as identified via the methodology in our article, ‘How to Create a "Trading Edge": Know the Strong and the Weak Currencies.' I will also share with you sentiment developments via IG Client Sentiment that can provide additional insight to help you decide what trends could extend.
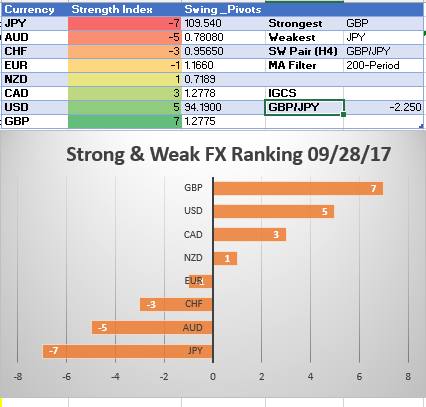
Strong/ Weak Index: September 28, 2017
Highlights:
-Traders in the market love a good reversal. I do too because that’s where the best trades emerge and the sustainability of a trend in the process is often in doubt without a good understanding of the fundamental underpinnings of the move. This month, DXY has seen a total range of 3.5% to the positive though the price is slipping from monthly highs on Thursday. The price of the index has been decidedly lower for most of 2017 has retraced 38.2% of the 2011-2017 range. The medium trend seems to favor that the rise in the USD will not have a long-life, but for traders looking for confirmation to either side should keep an eye on US Yields. The same force that pushes the USD higher also aligns with the selling of US Treasuries in expectation of inflation, and that produces higher yields. Therefore, if the US 10Y yield creates space above the 200-DMA, we could see further USD strength.
-One reason I like the SW approach to markets is that it favors trend continuation. When a fundamental driver aligns with an extreme ranking, there is often momentum back of the move, which helps to stay with the market. The British Pound, currently the strongest in the index was lifted on Thursday on comments that the Chief Negotiator of from the EU for Brexit noted a “new dynamic” after May’s recent rhetoric. While obstacles admittedly remain, this comment was enough to help lift the British Pound by nearly 0.5% against the USD in the growing hope that the negative effects of the Brexit vote will be mitigated to a higher degree.
-The EUR has rebounded as per EUR/USD after a rough month and a specifically rough three days to start the week. While month-end flows are messy, traders should keep an eye the current weekly low near 1.1714, which combines the daily Ichimoku Cloud as well as the August 2015 high. A hold of this level (it’s too soon to put too much hope on this) would argue for a polarity point developing that favors a higher floor in the price and a stronger EUR on the horizon especially against weaker currencies (e.g., not GBP for now).
-The Swiss Franc (CHF) should also hold your attention for the time being as a pricing pattern is known as a triple-top since June could be in the works. What is fascinating in markets is when a pattern fails (i.e., a triple –top does not hold, and price breaks out aggressively higher), which is what the IGCS picture favors. However, the sentiment is not perfect, and if the price is unable to close above 0.9770 (June high), we could see a string of USD weakness or CHF strength (risk-off?) to open the month of October. Another point to mention, a long-term price channel holds resistance near the current price, and the 38.2% Fibonacci retracement of the pair's drop for 2017 is also at 0.9770. Get your popcorn ready, and let's see some volatility!
Interested in DailyFX’s FREE longer-term price forecasts? Click here to access
IGCS Highlight: Increase USD/CHF shorts favor failed triple-top pattern
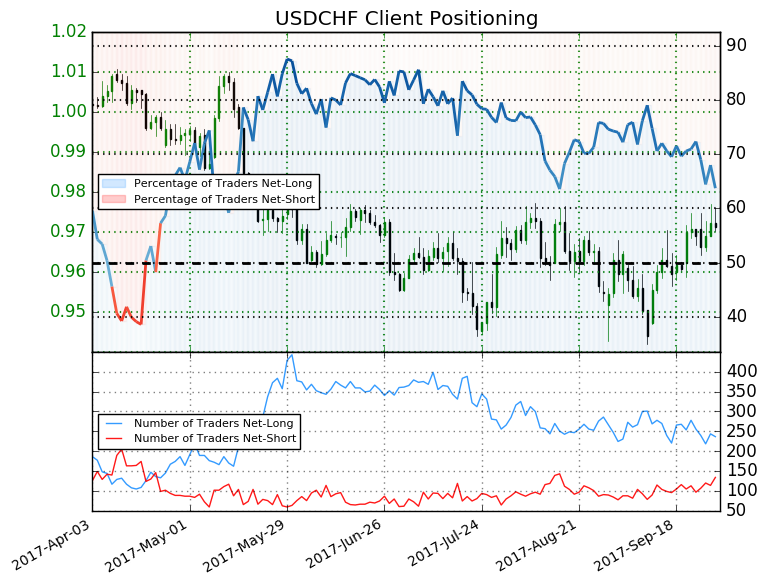
USDCHF: Retail trader data shows 63.7% of traders are net-long with the ratio of traders long to short at 1.76 to 1. In fact, traders have remained net-long since Apr 21 when USDCHF traded near 0.99189; price has moved 2.1% lower since then. The number of traders net-long is 7.8% lower than yesterday and 18.3% lower from last week, while the number of traders net-short is 22.7% higher than yesterday and 35.0% higher from last week.
We typically take a contrarian view to crowd sentiment, and the fact traders are net-long suggests USDCHF prices may continue to fall. Yet traders are less net-long than yesterday and compared with last week. Recent changes in sentiment warn that the current USDCHF price trend may soon reverse higher despite the fact traders remain net-long (emphasis added.)
For a deeper explanation on what’s been shared above, please join the FX Closing Bell Webinar with Tyler Yell
---
Written by Tyler Yell, CMT, Currency Analyst & Trading Instructor for DailyFX.com
To receive Tyler's analysis directly via email, please SIGN UP HERE
Contact and discuss markets with Tyler on Twitter: @ForexYell


